Demo
A quick visual tour of Compass using the local development stack.
Services Dashboard
The services dashboard is the primary operator view: discovered services, source-aware grouping, filters, pinned services, recent services, and quick actions in one place.
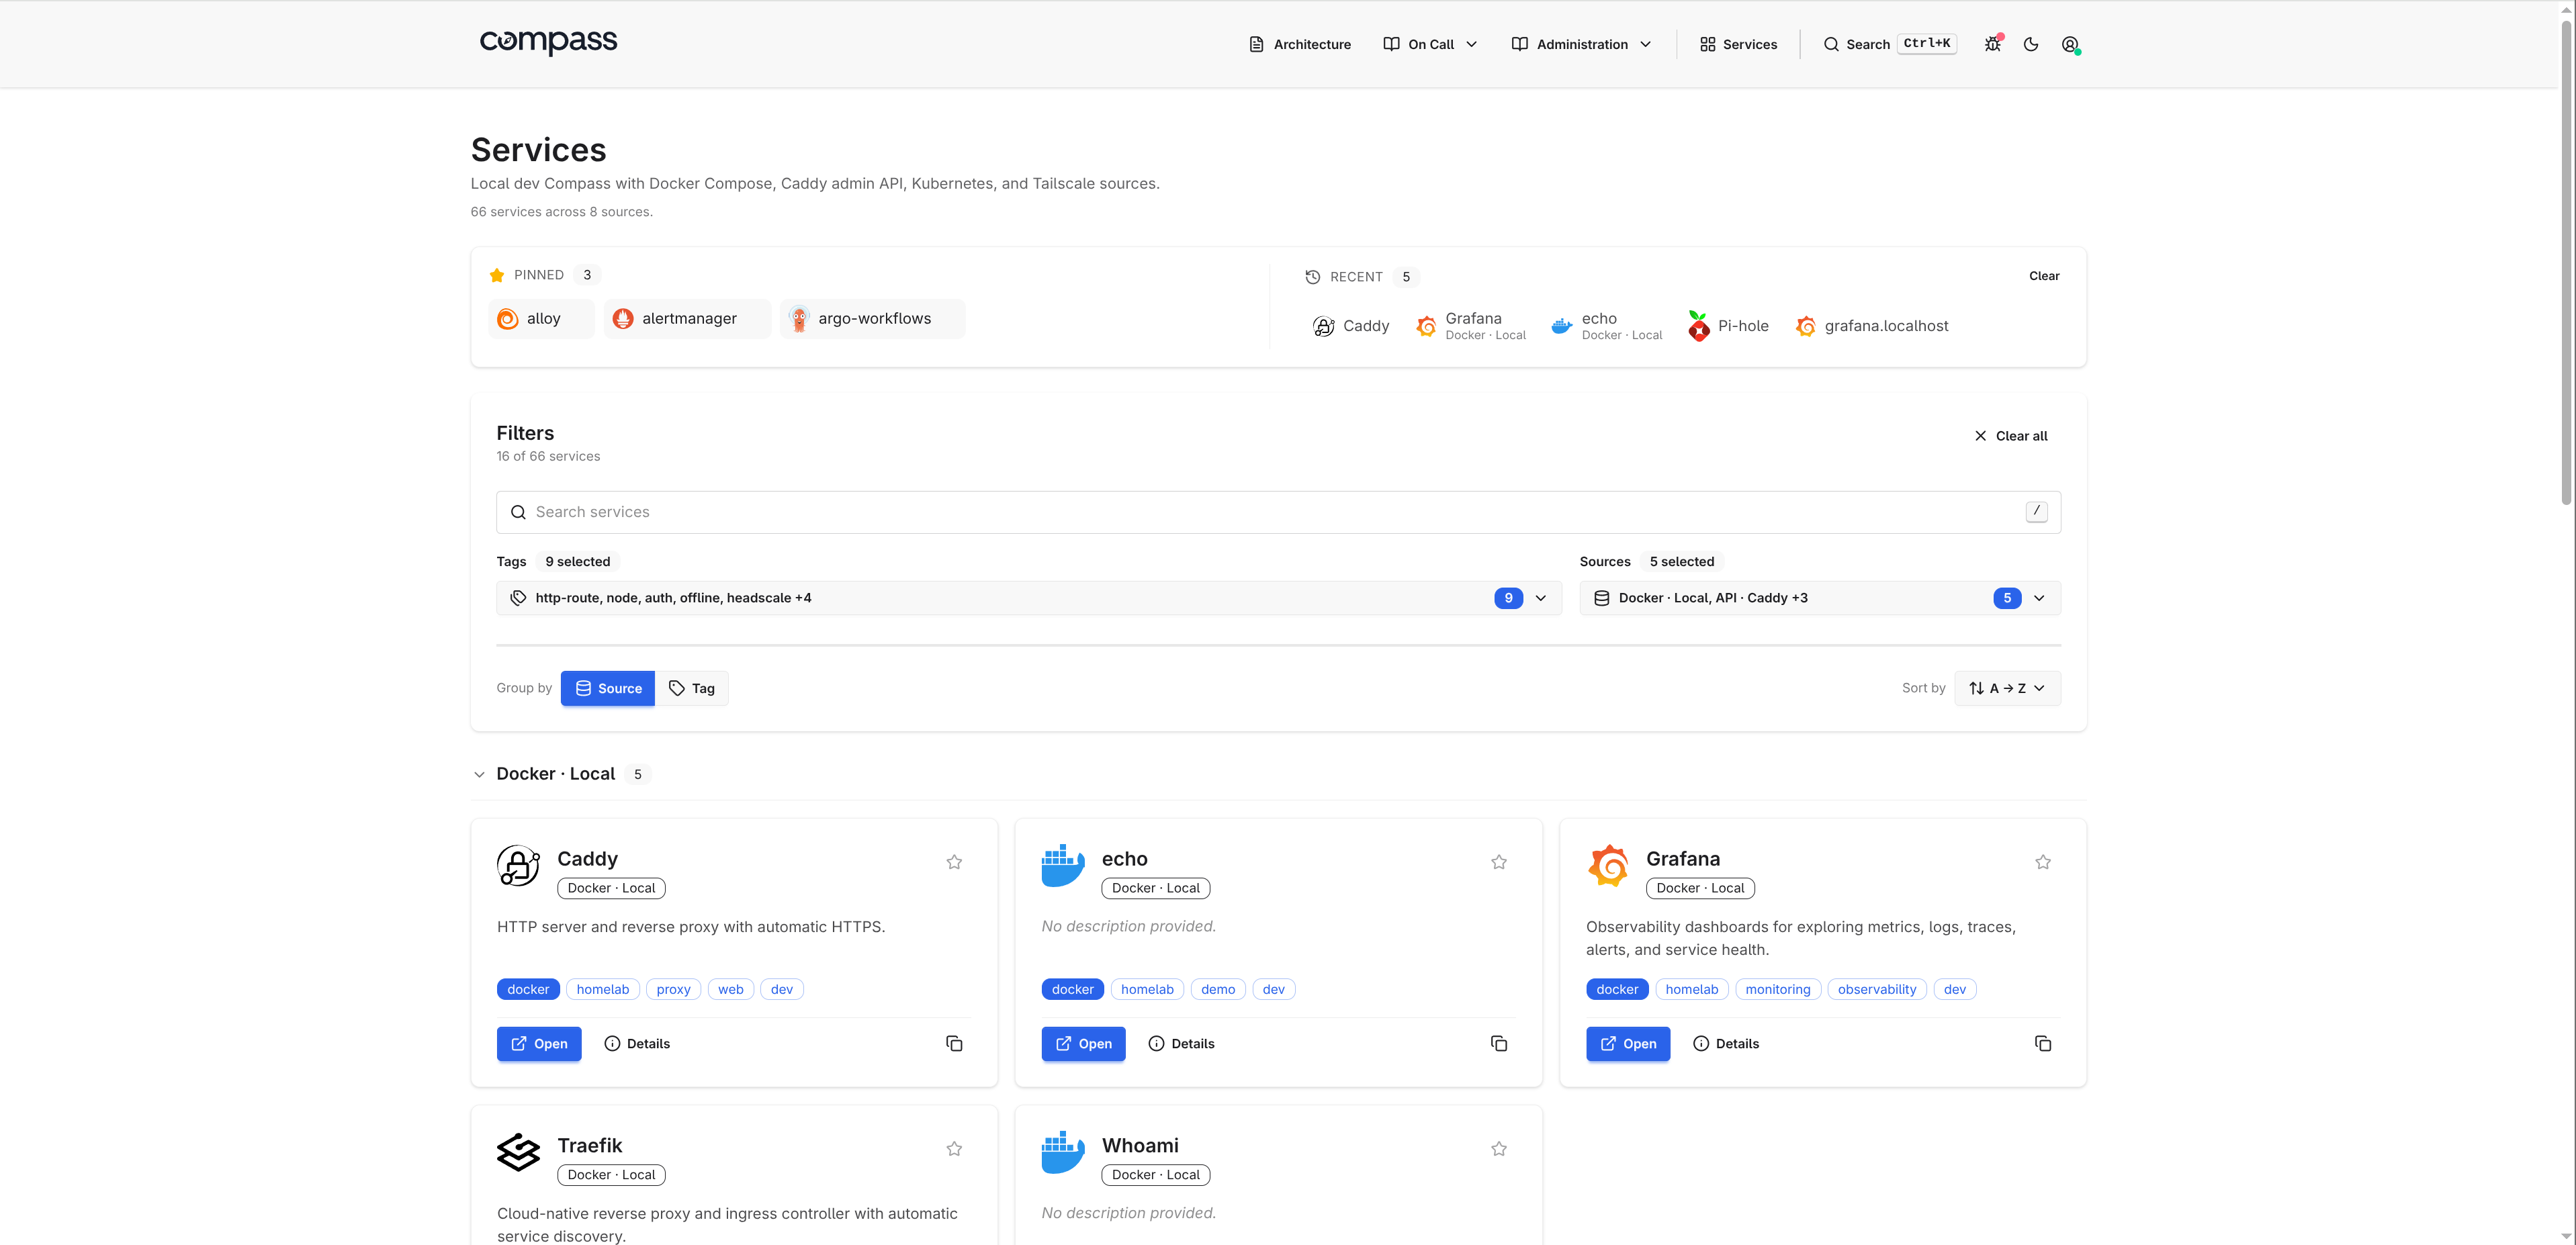
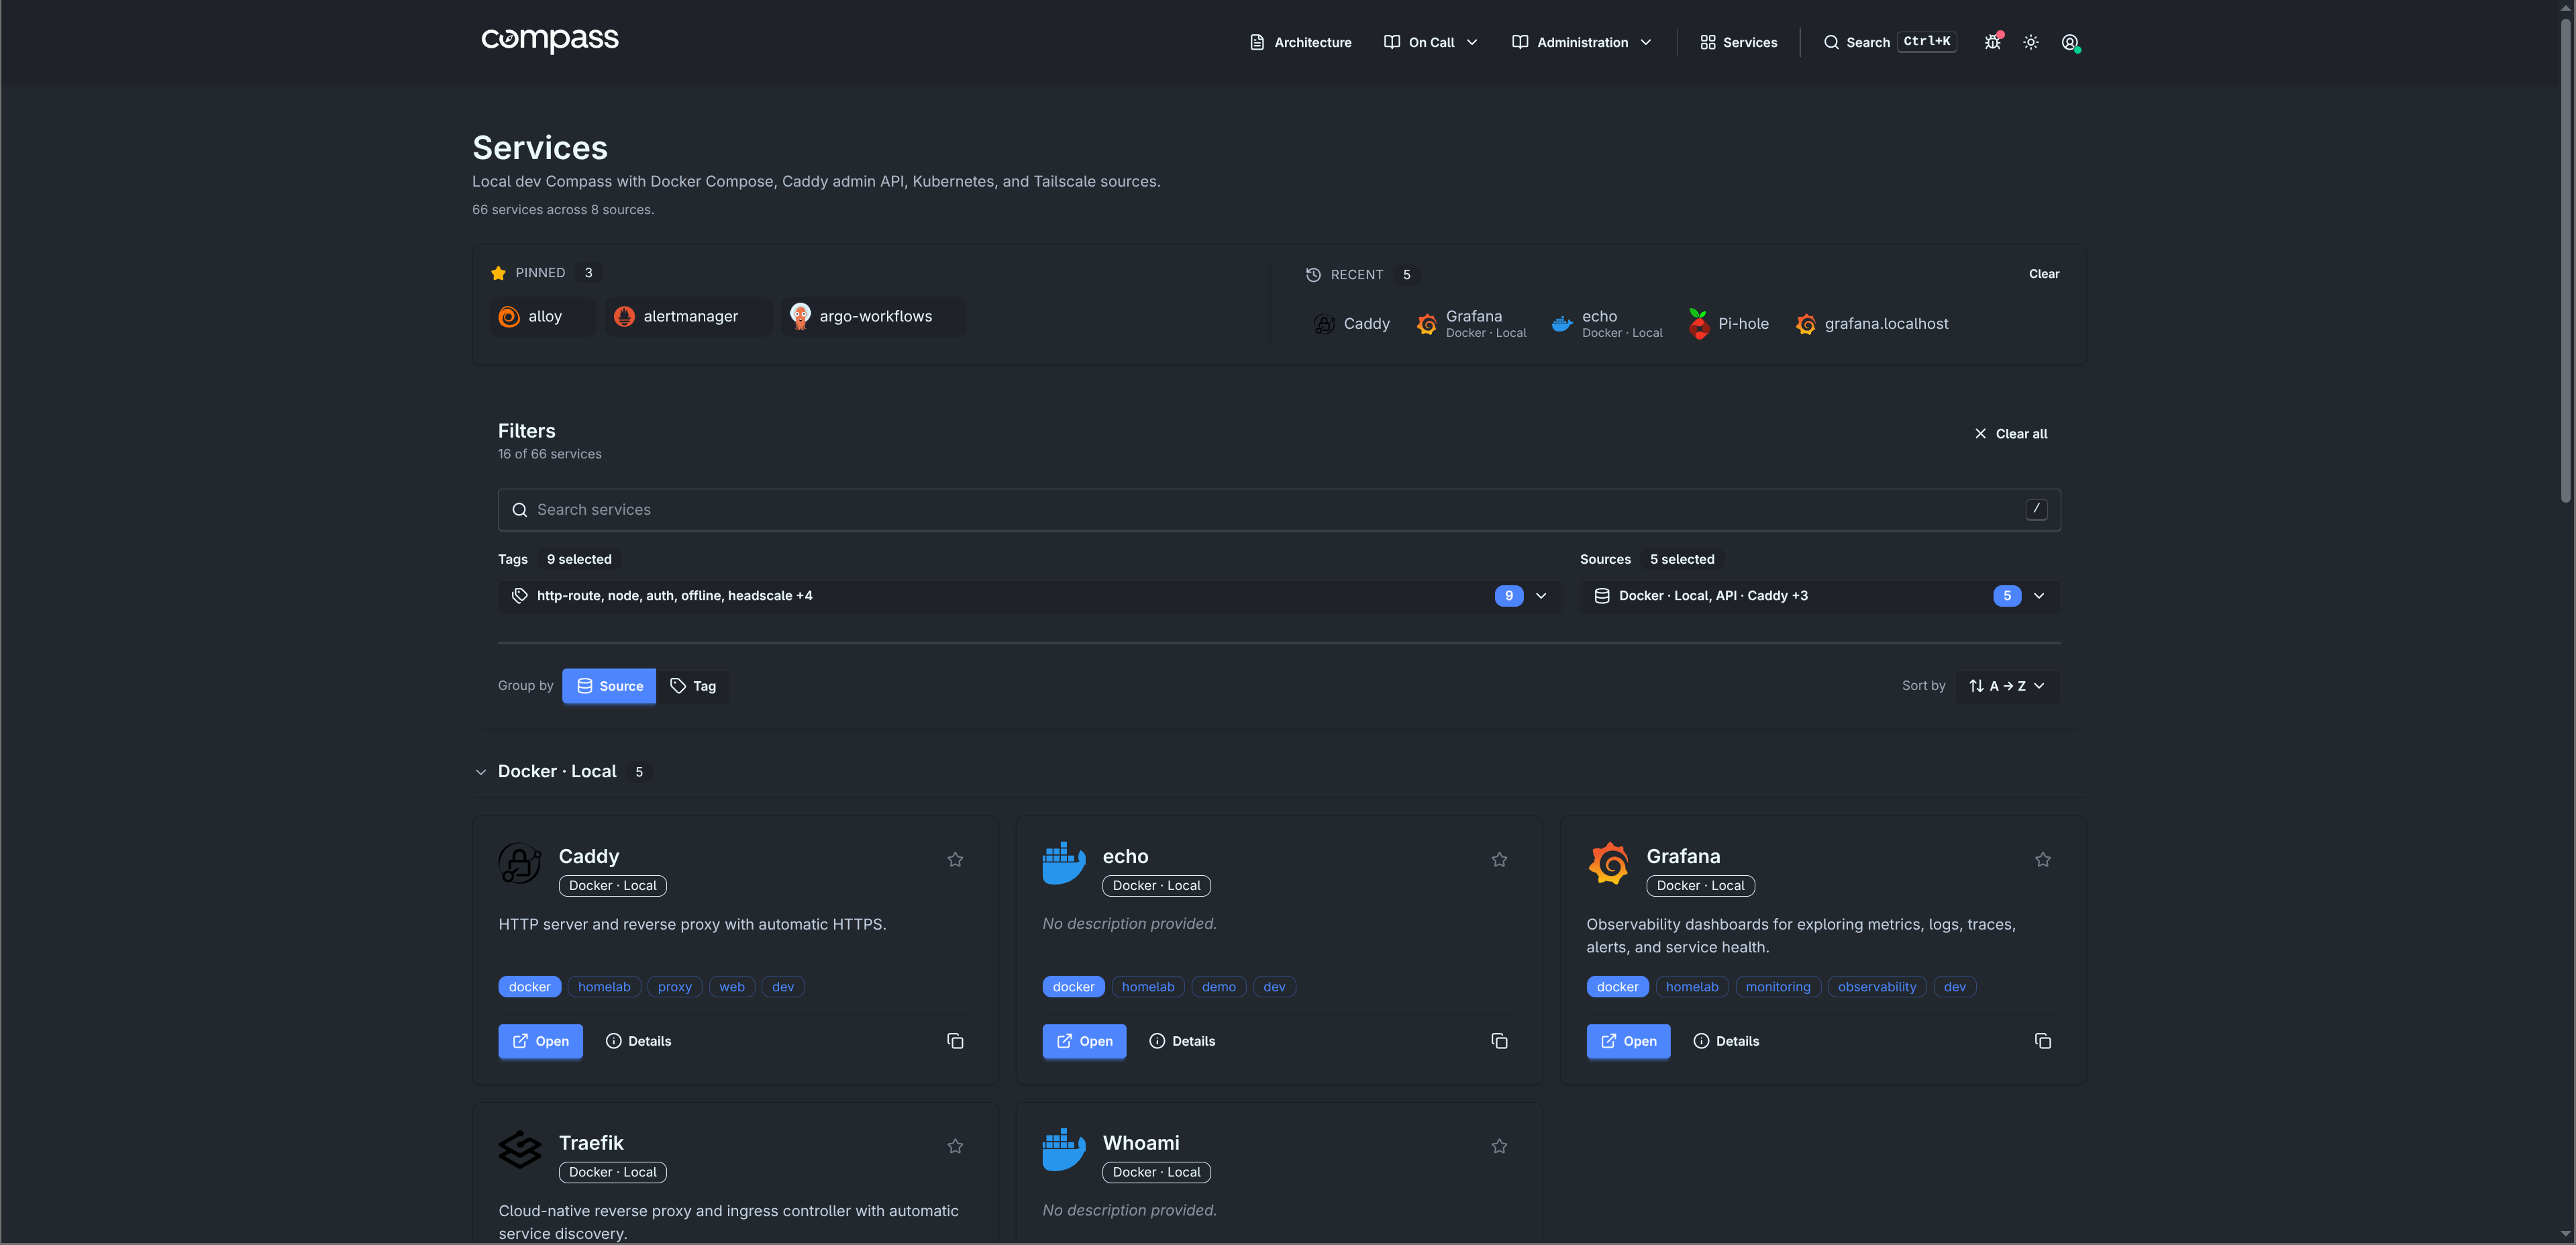
The same dashboard supports theme switching without changing the underlying server-rendered UI.
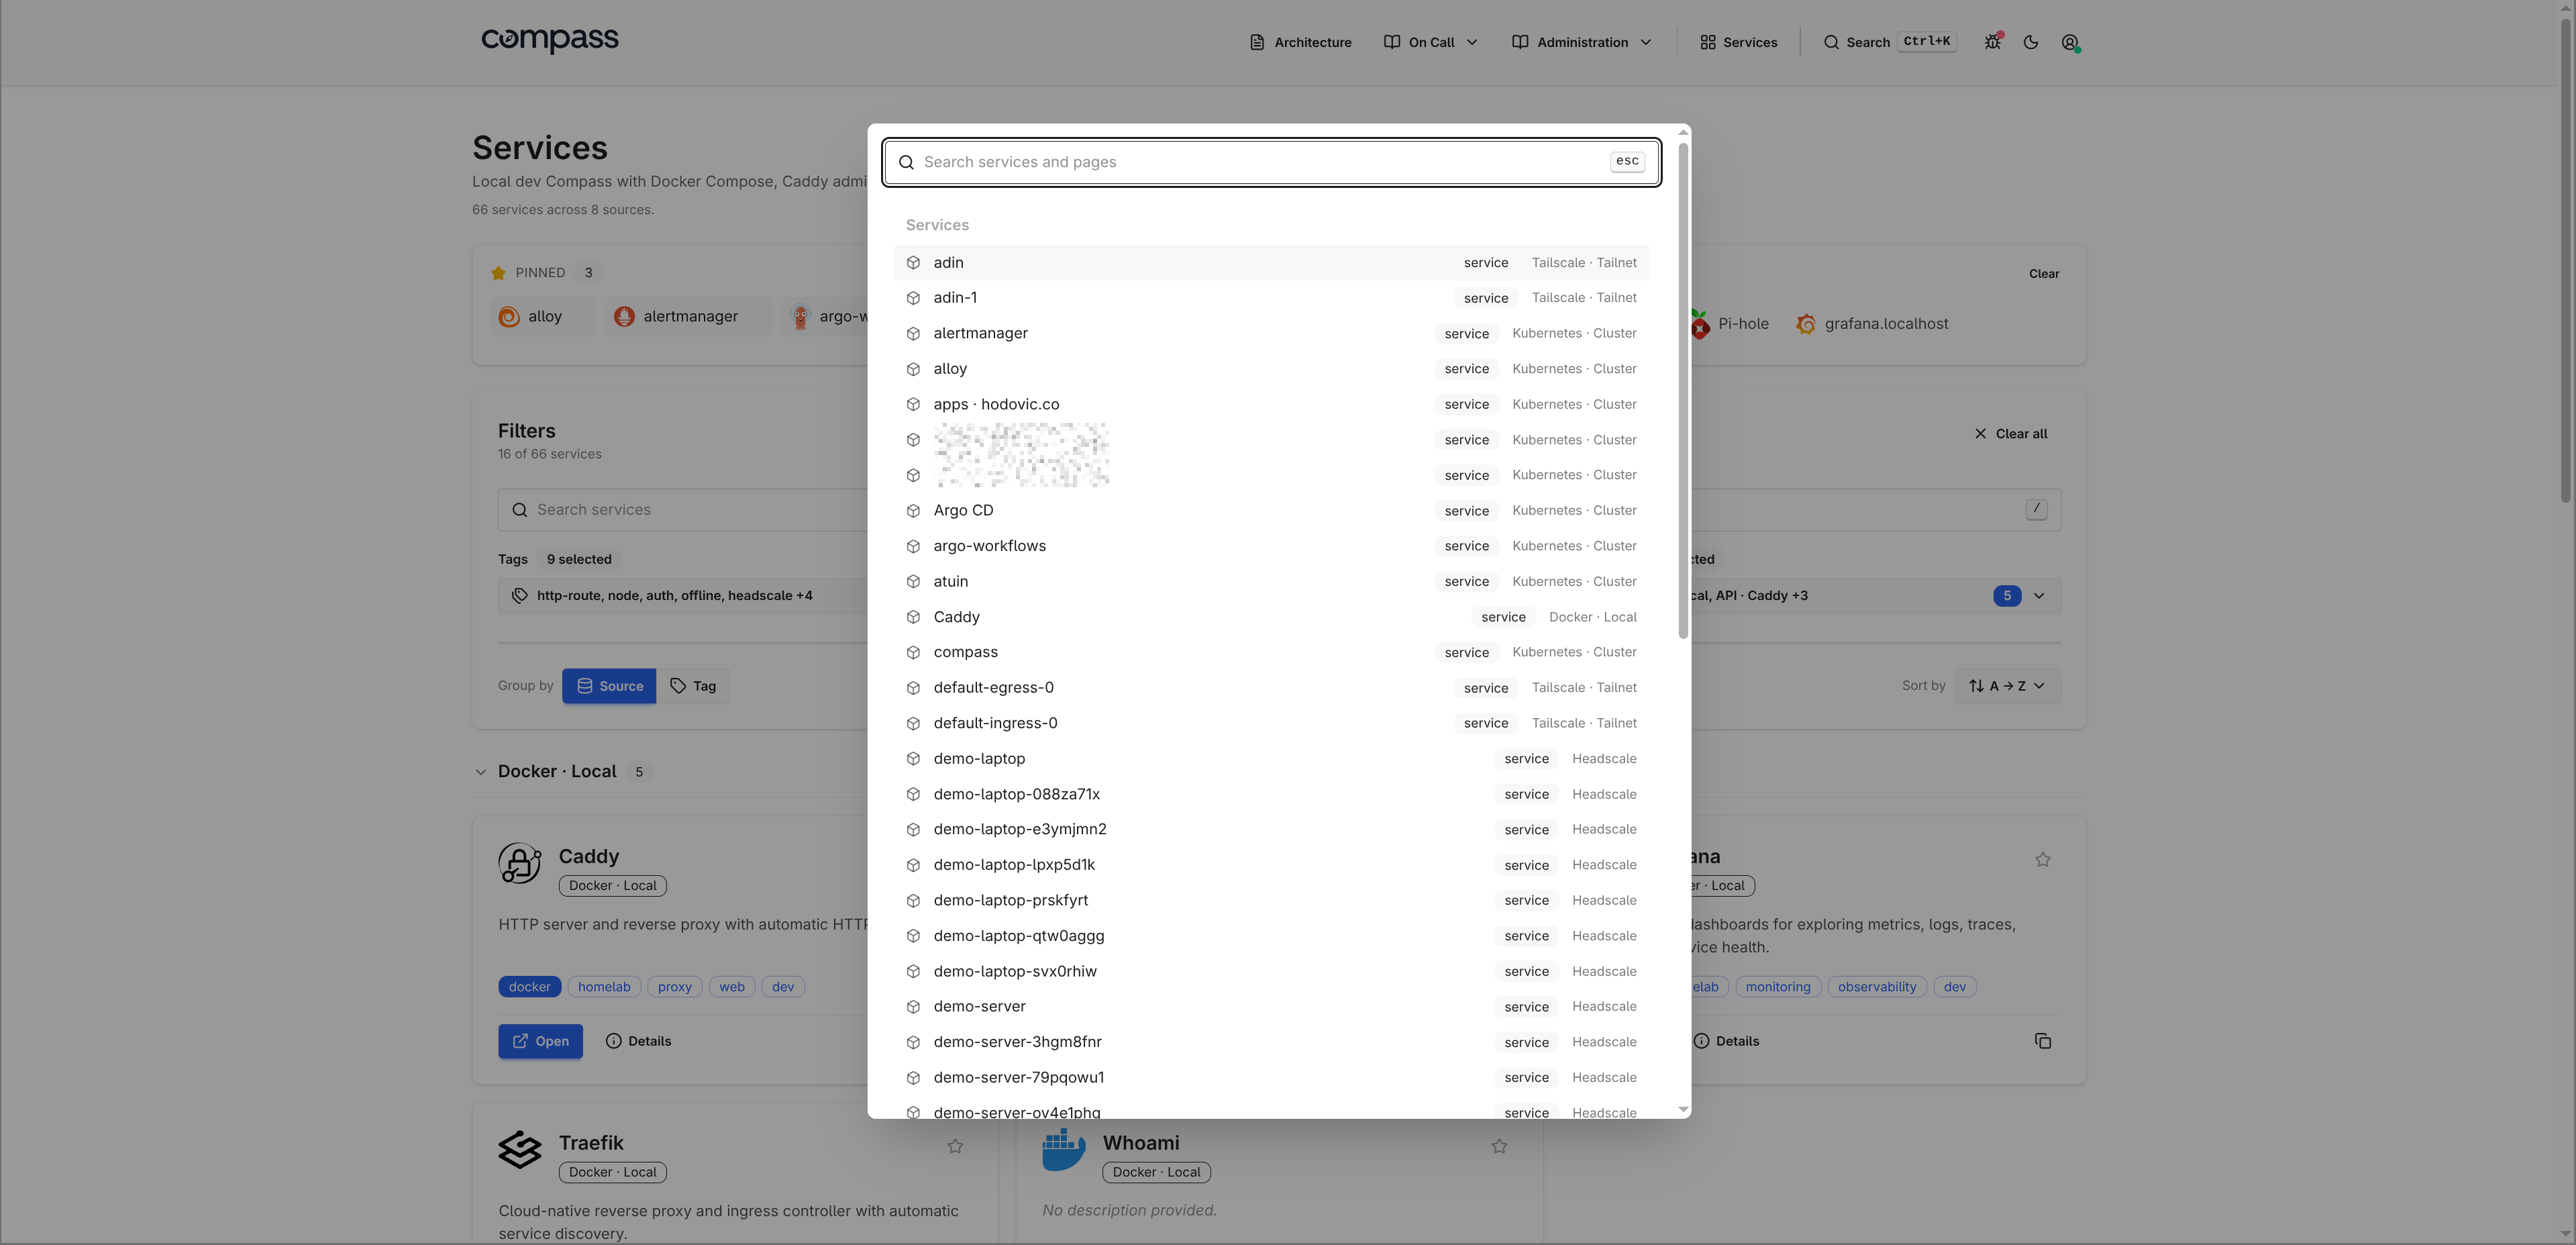
Search narrows the registry quickly and keeps filters, grouping, and sort controls close to the results.
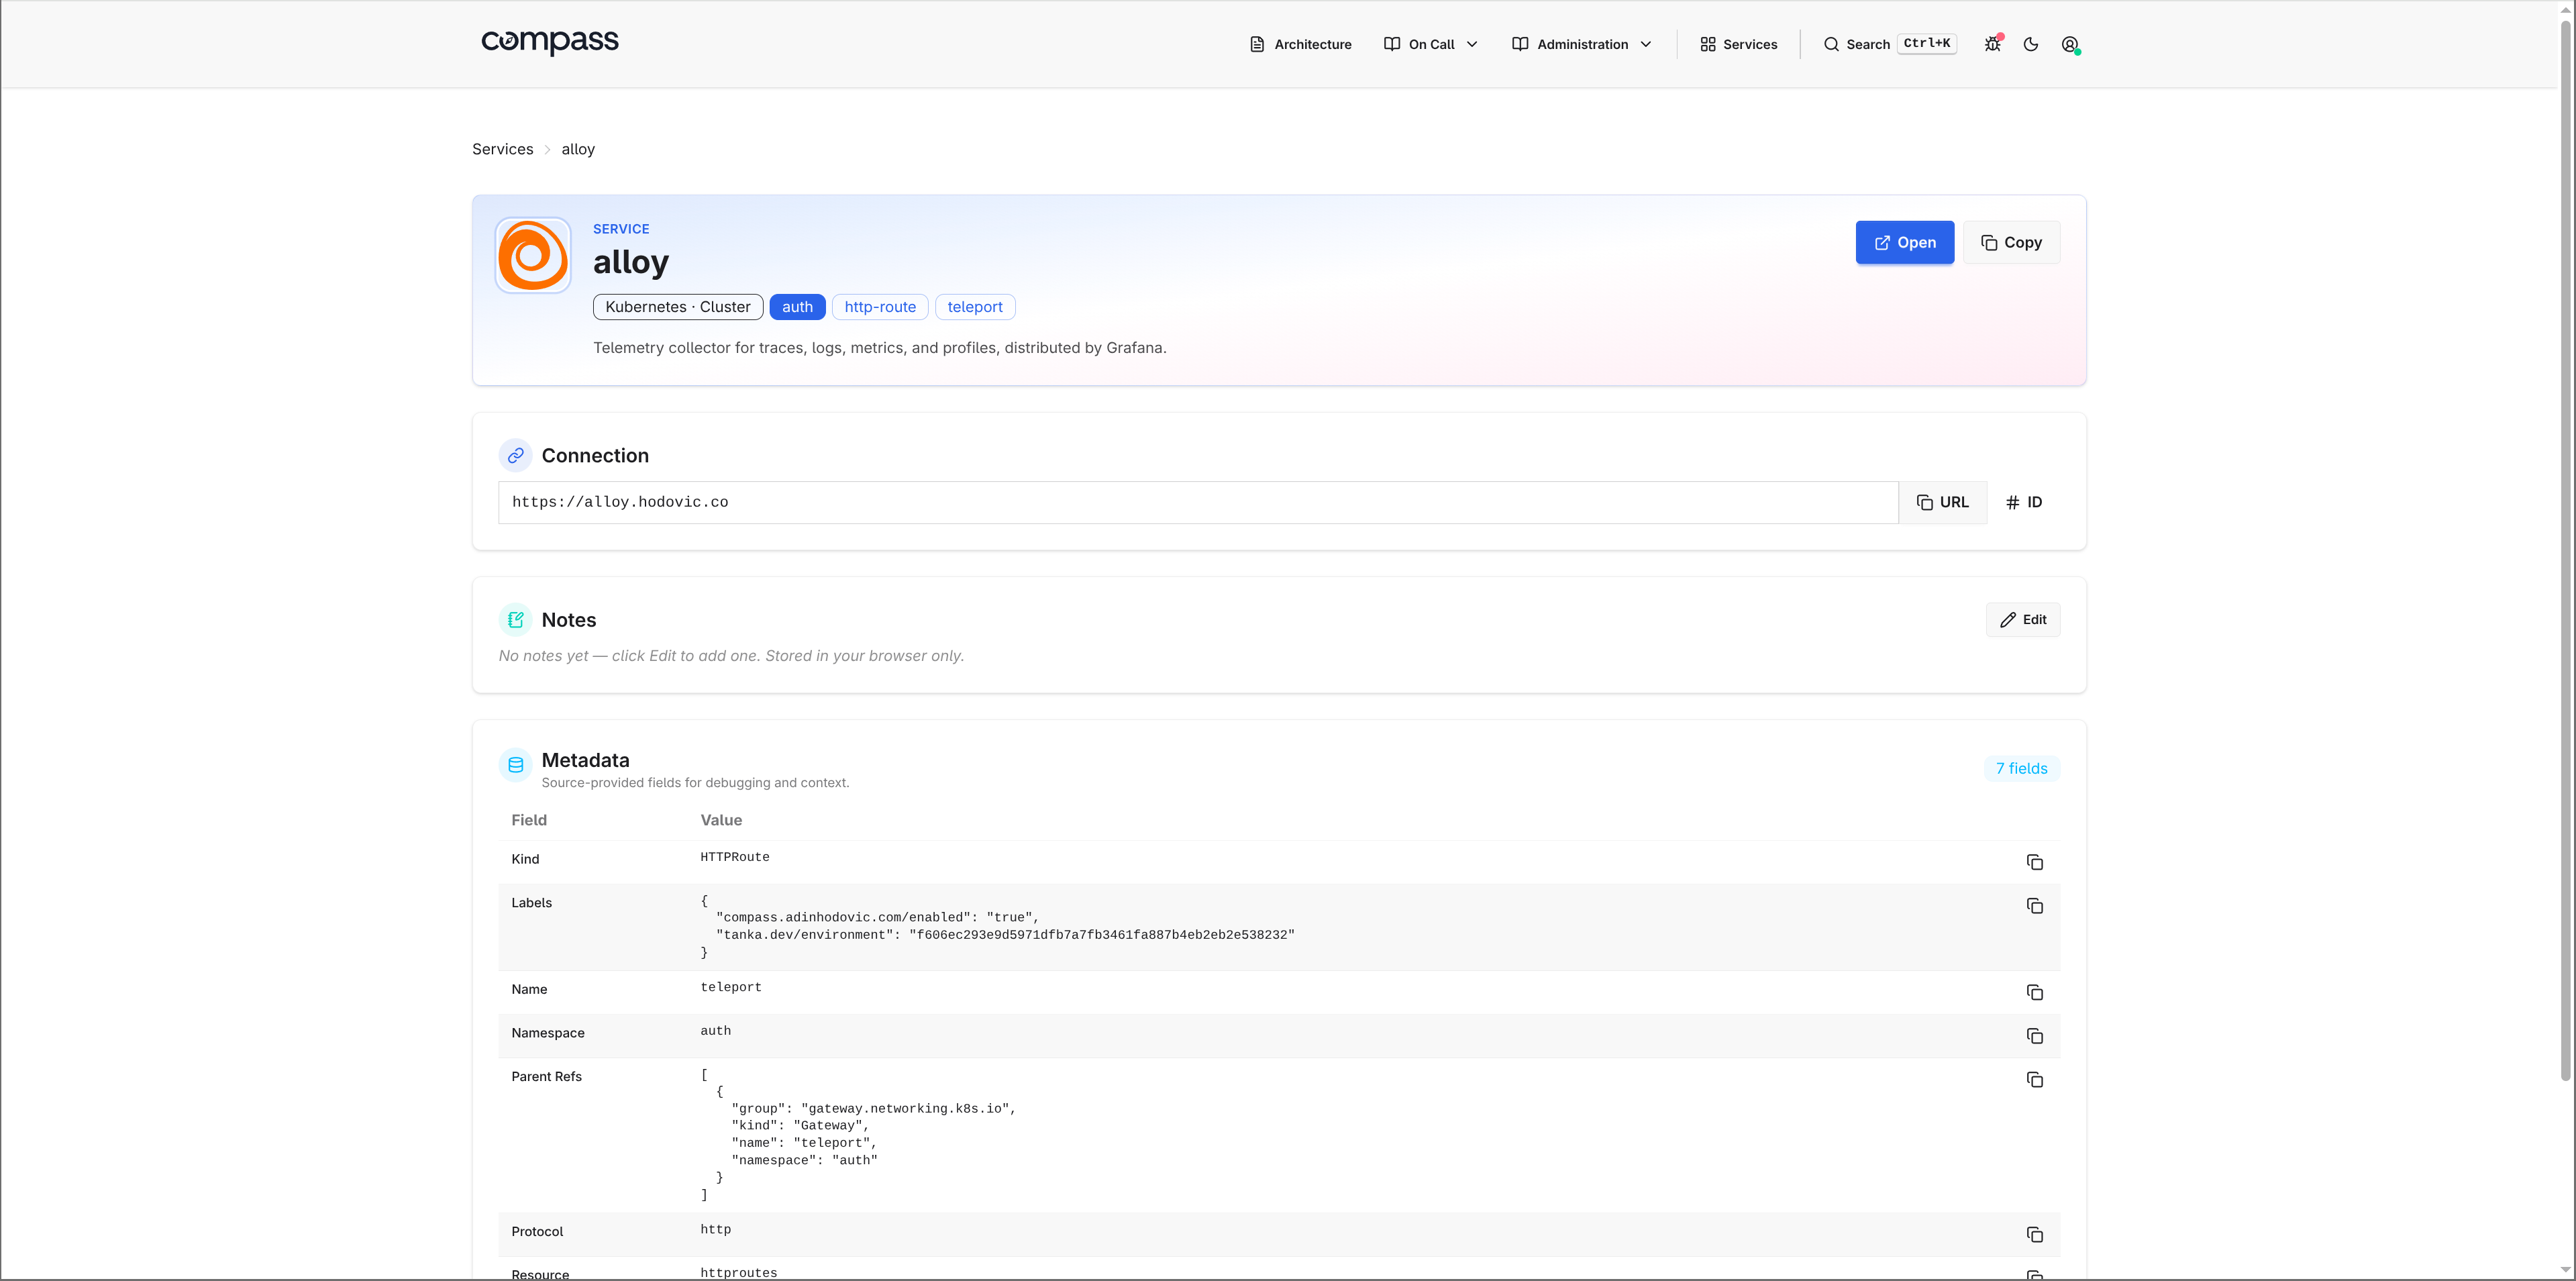
Each service has a detail page with its URL, metadata, tags, embedded Grafana panels, and backlinks to any markdown pages that reference it.
Pages
Compass can render markdown pages alongside the dashboard. Use them for runbooks, architecture notes, on-call docs, and other operator context.
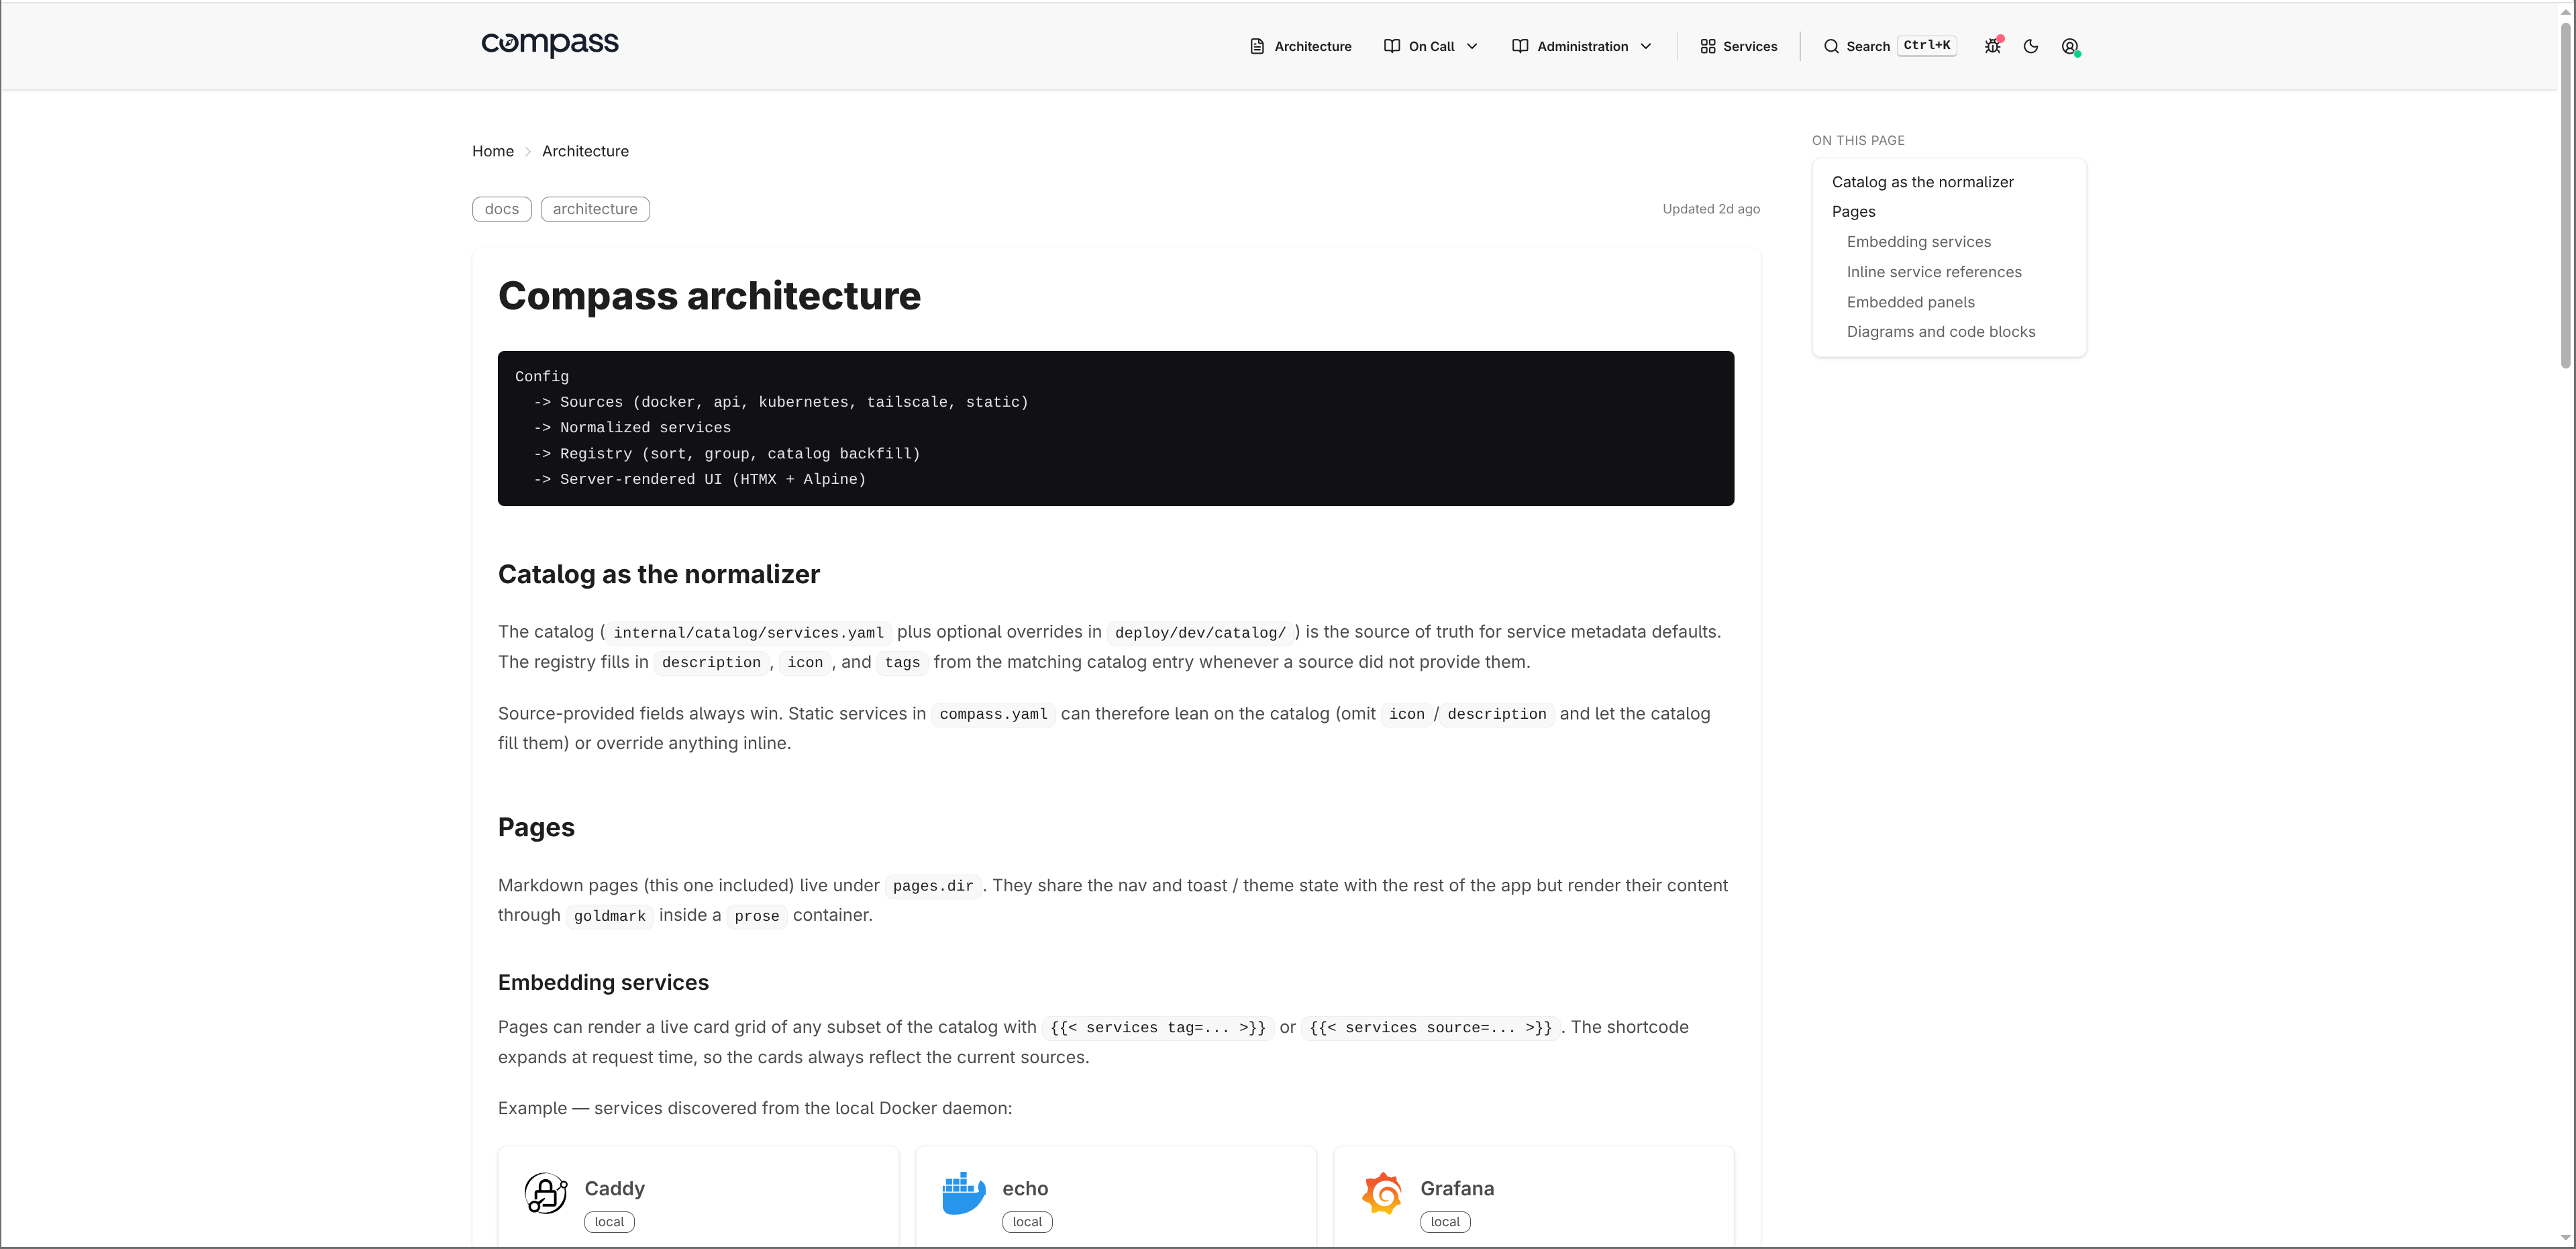
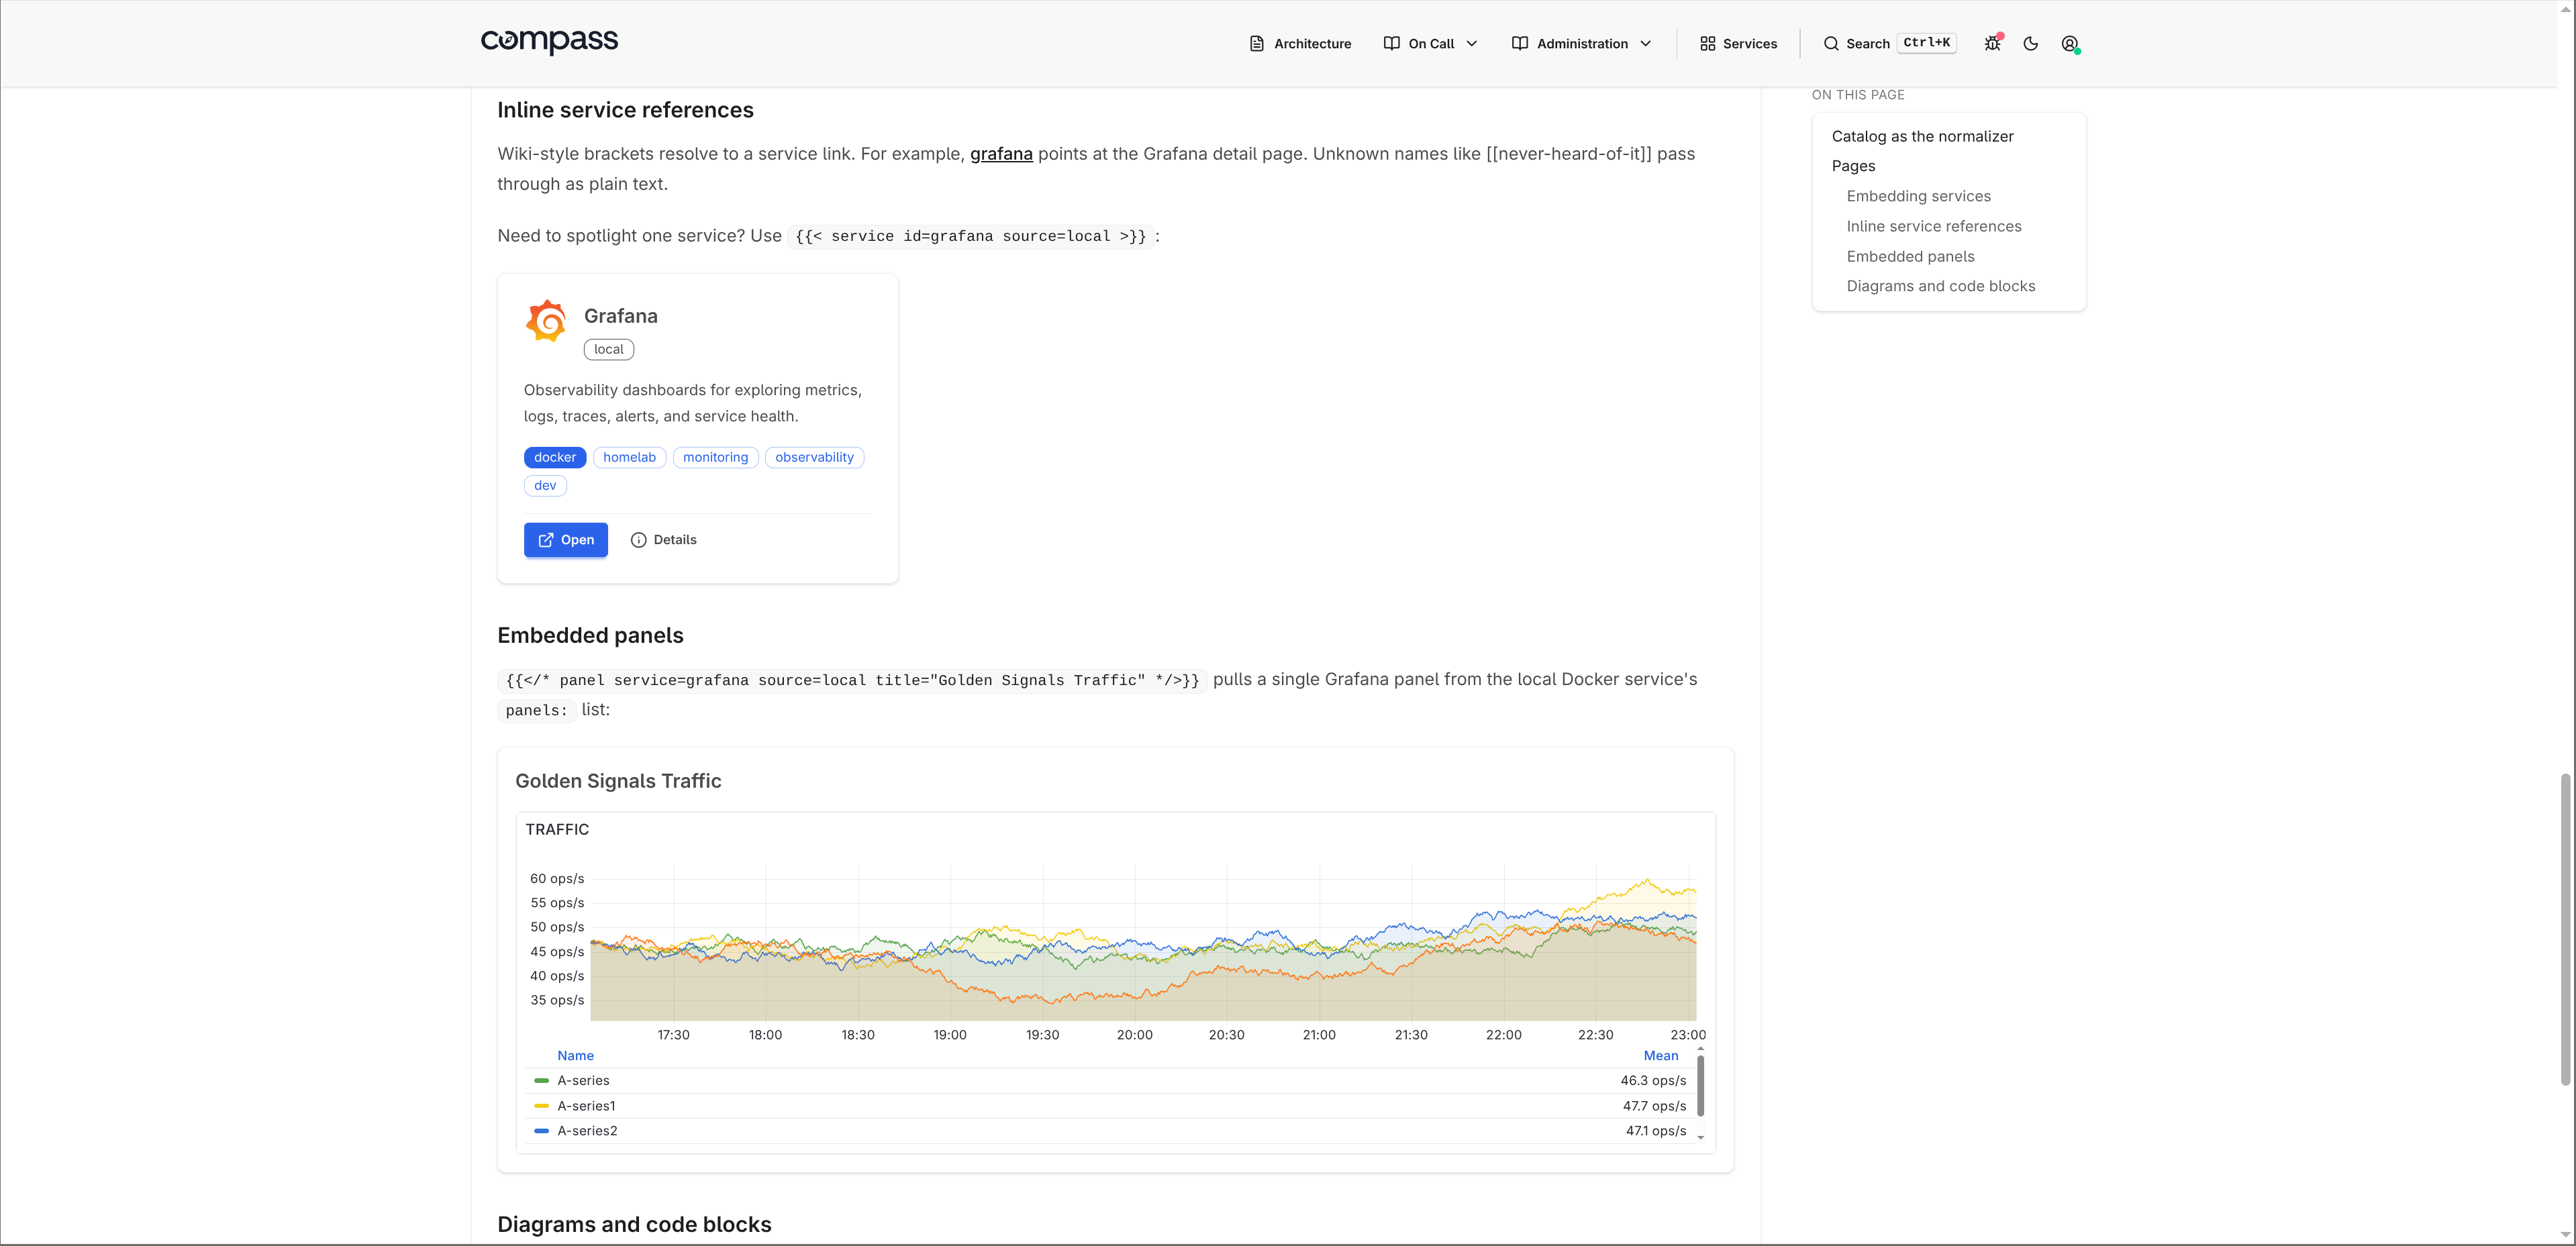
Pages can also embed live service cards and Grafana panels so documentation stays connected to the currently discovered registry.
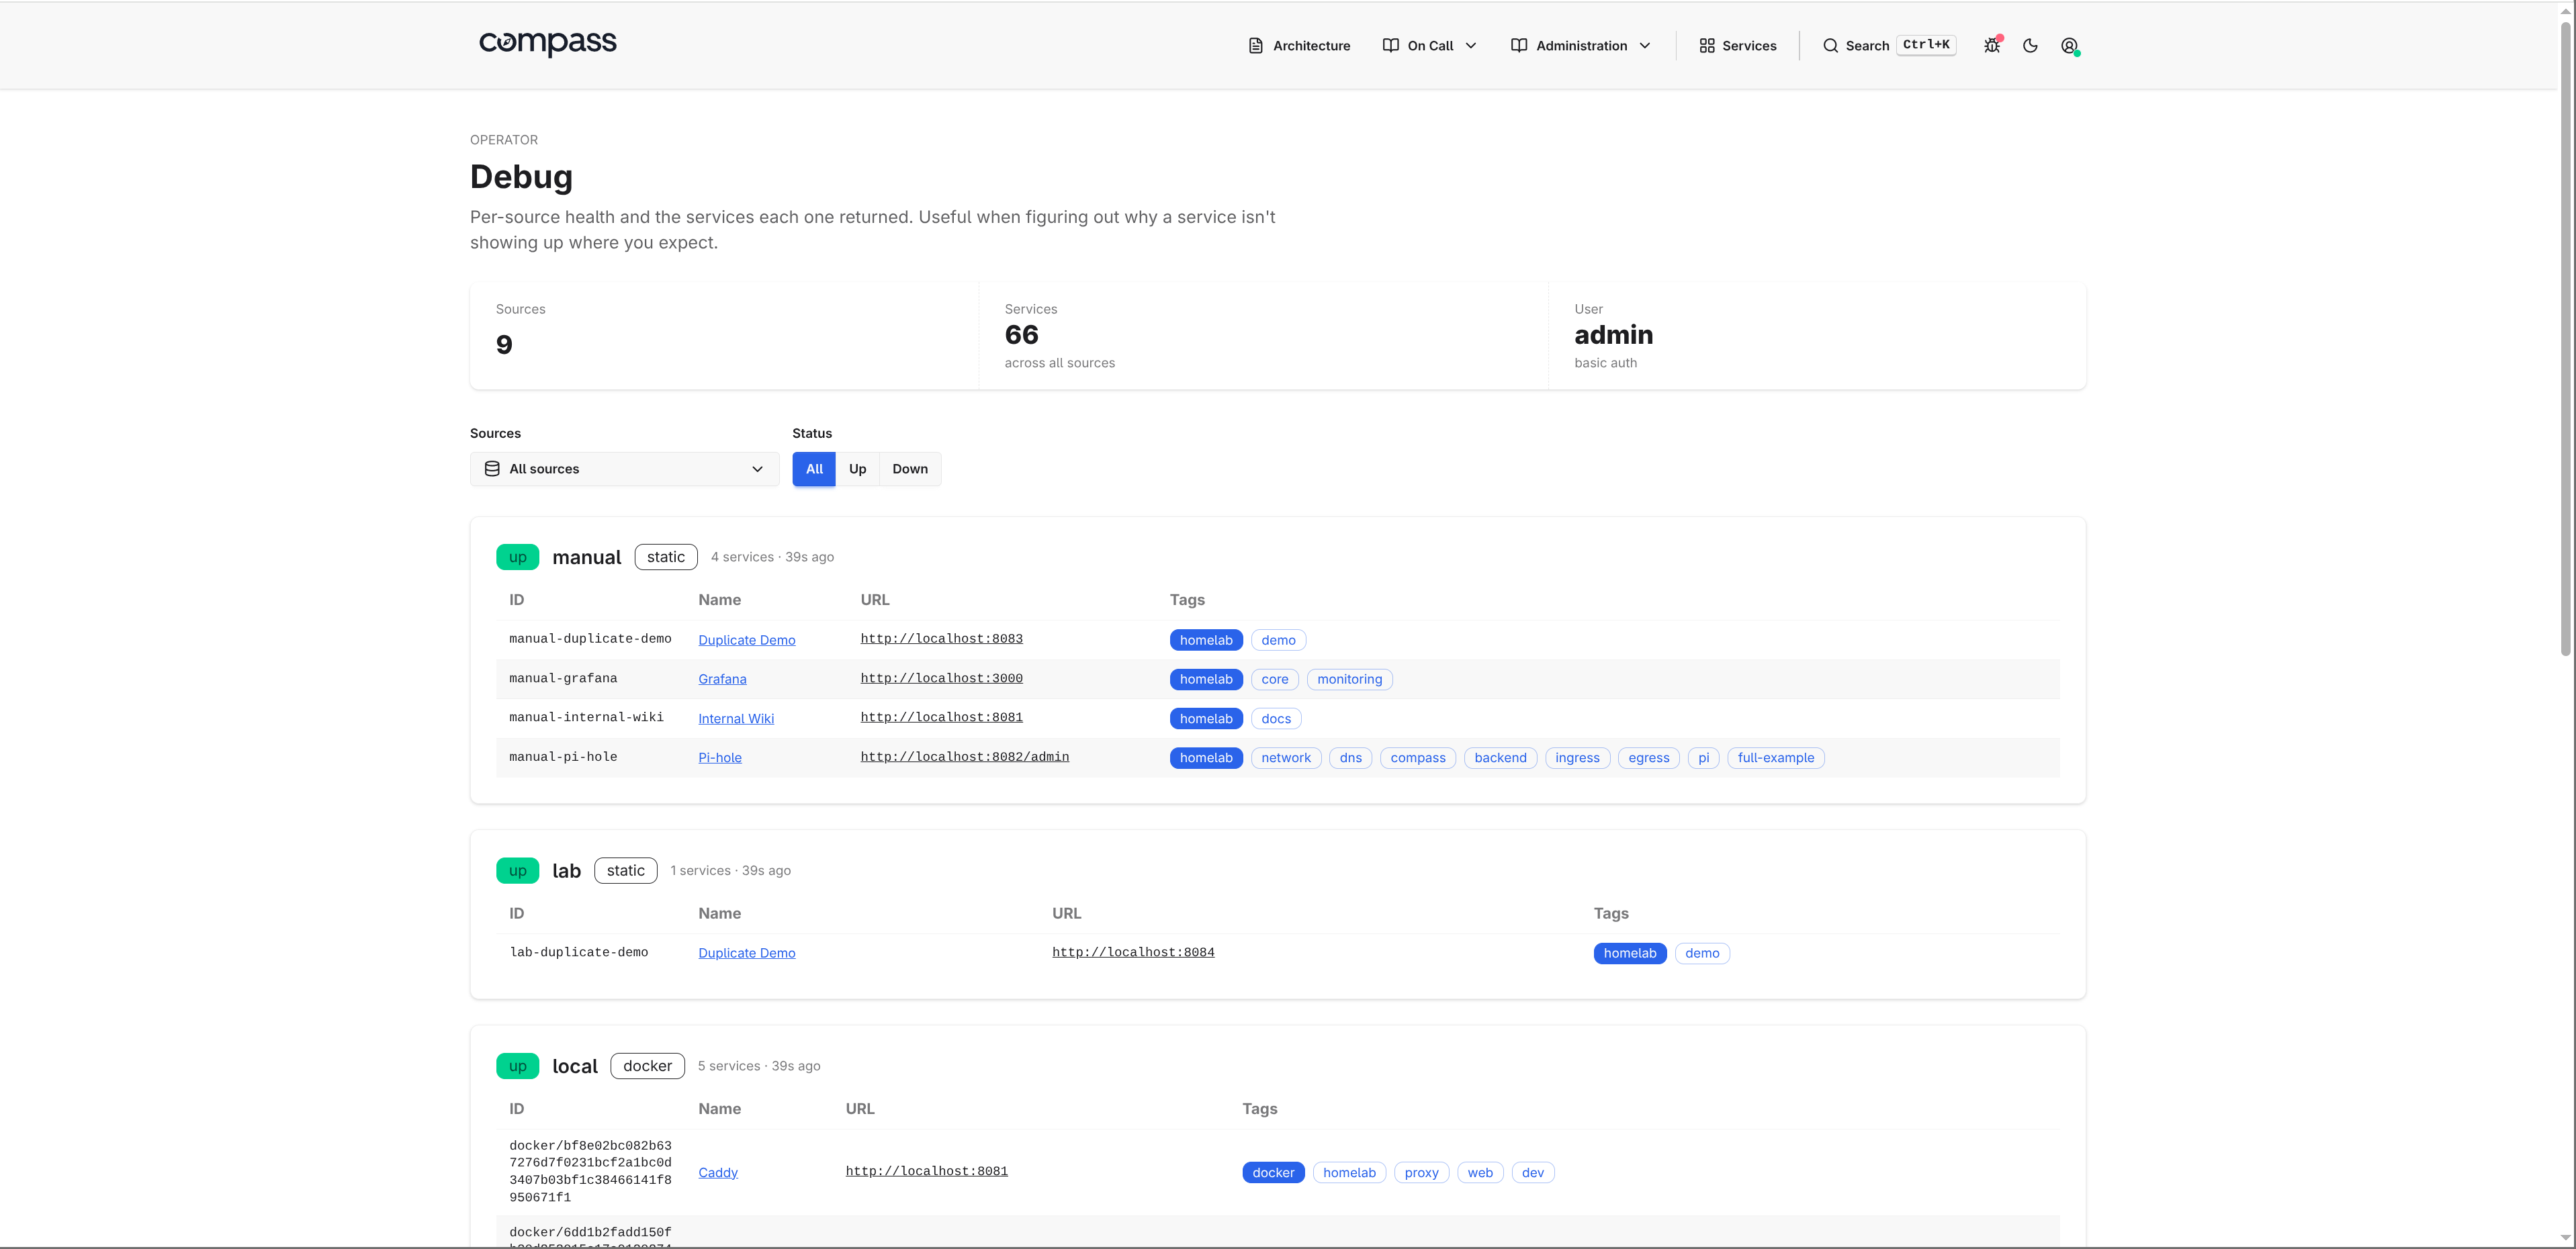
Debug
The debug page shows per-source health and the services each source returned. It is useful when a service is missing, duplicated, or coming from an unexpected source.