Operations
Runtime tools for checking Compass: debug, health, metrics, logs, and troubleshooting.
Runtime endpoints
The operator-facing endpoints are /debug, /health, and /metrics. The
dashboard, service detail pages, markdown pages, static assets, and manifest
are normal UI routes covered in Getting Started and
Pages.
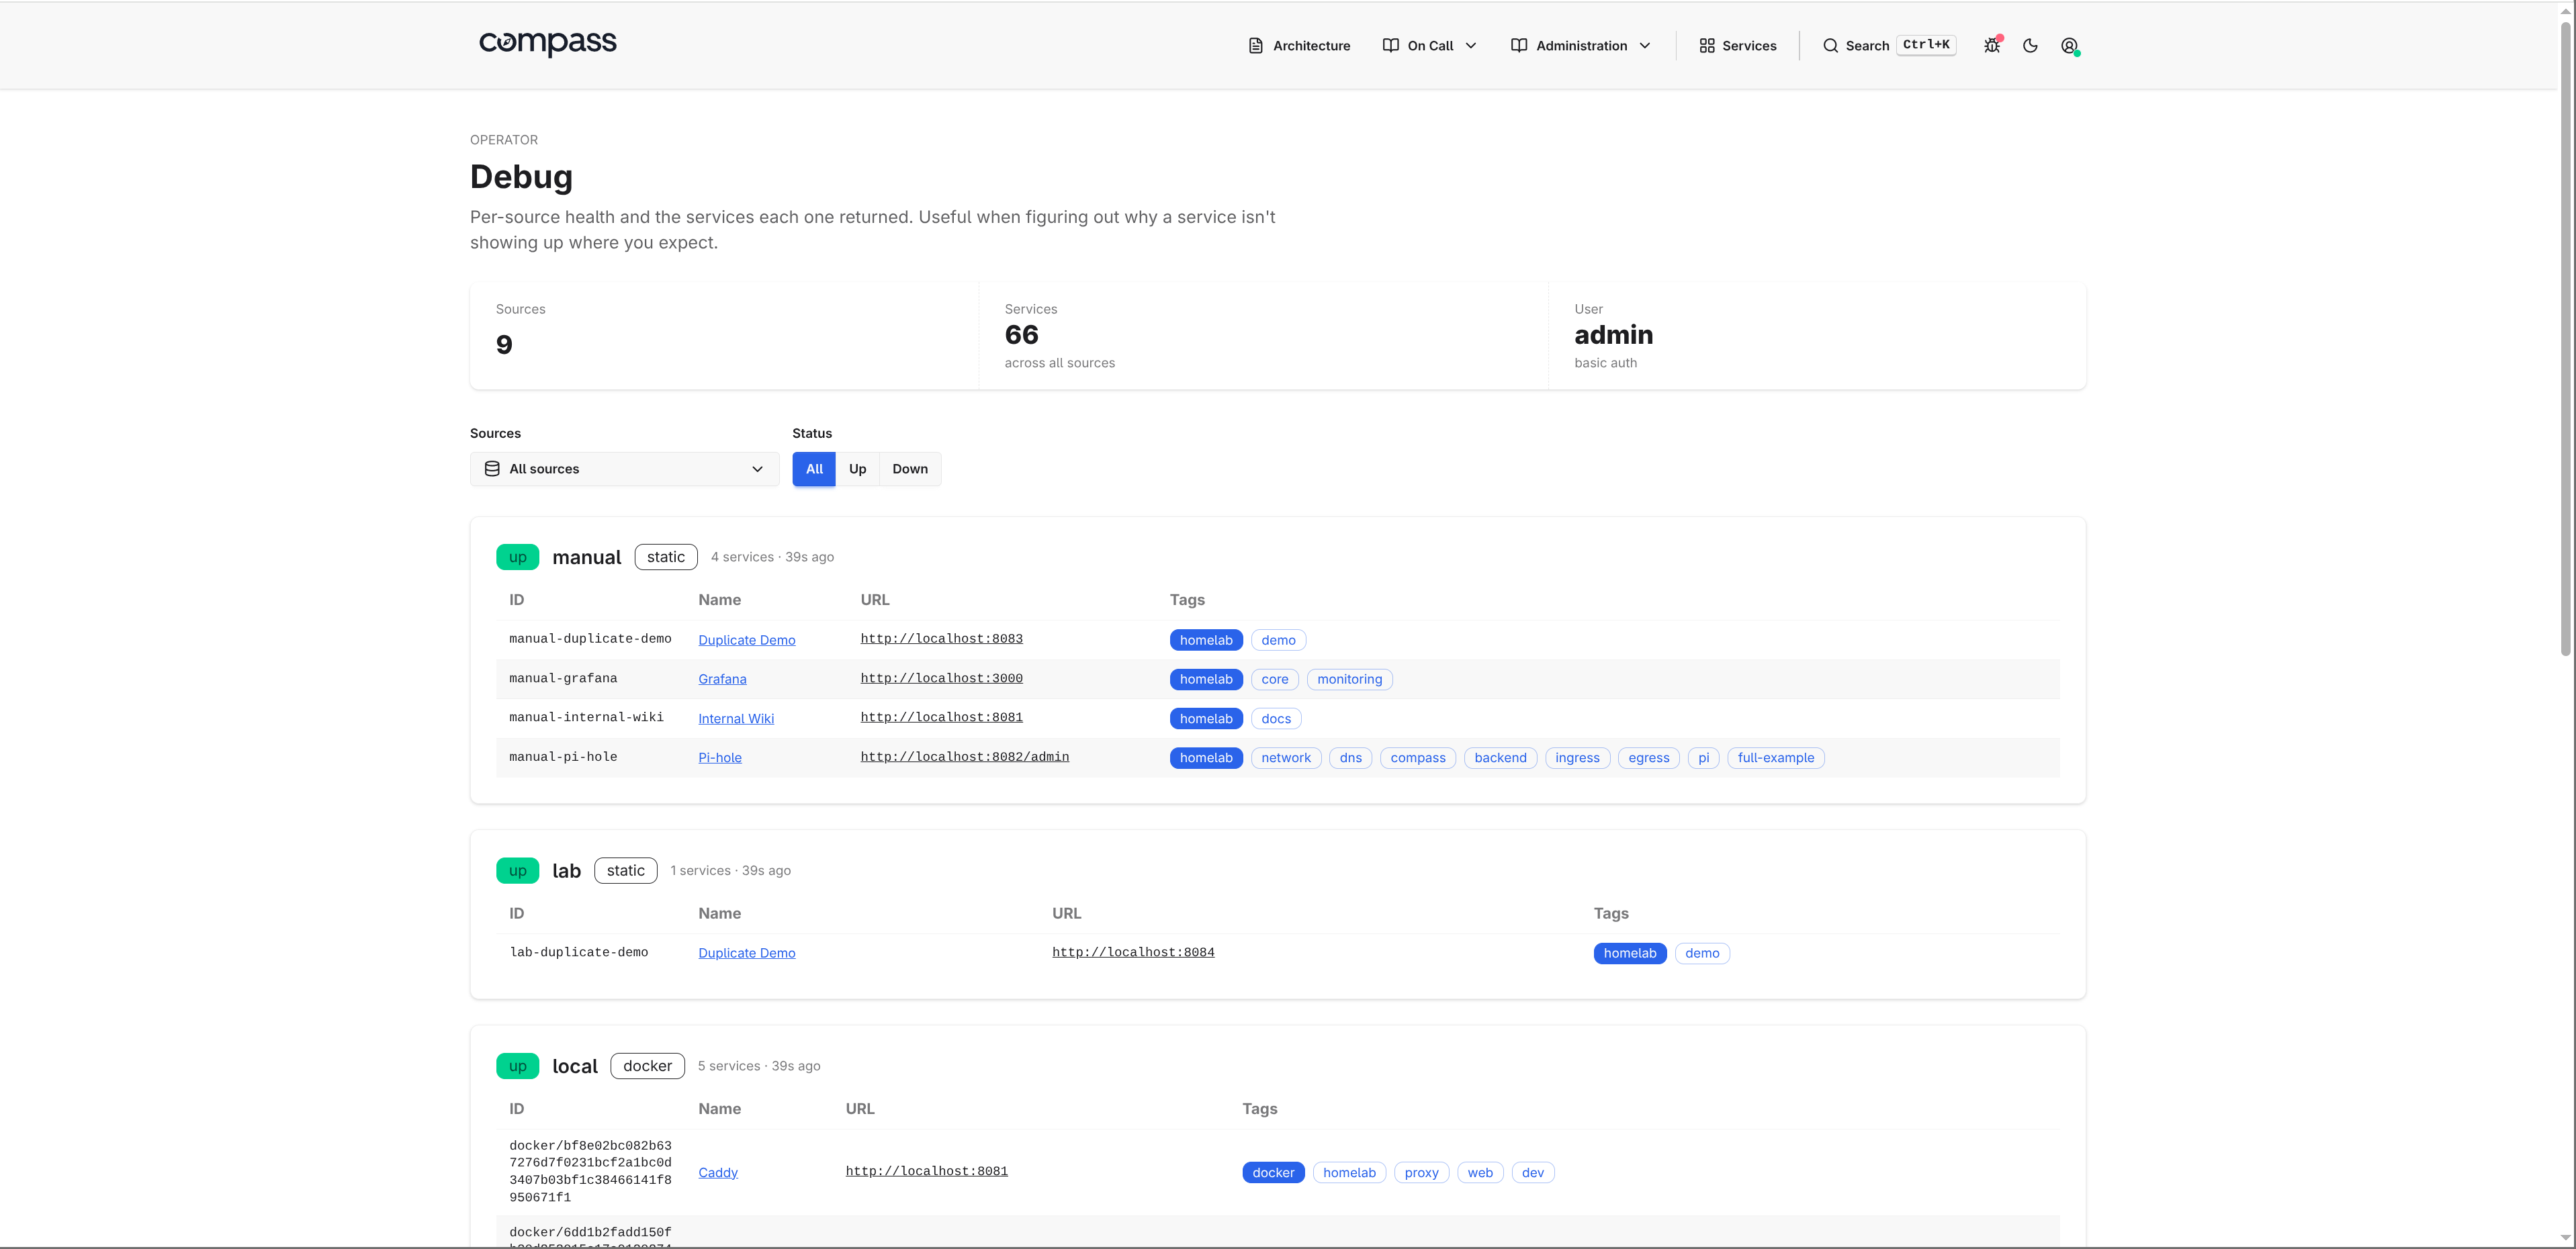
/debug
A per-source health view. For every configured source it shows a
status badge (ok / error / pending), the service count and last
load time, the discovery output as a table, and the error message when
the last refresh failed.
The navbar bug icon shows a small red dot whenever any source's last
load reported an error, so you don't have to keep /debug open to know
something is unhealthy.
On by default. Set debug.enabled: false in compass.yaml to suppress
the route. Any request to /debug then returns 404.
/health
Liveness endpoint for load balancers and orchestrators. Returns HTTP 200
with {"status":"ok"} and is unauthenticated regardless of the configured
auth mode.
/metrics
Prometheus exposition format. Default scrape config is fine; the endpoint is unauthenticated regardless of the configured auth mode so scrapers don't need credentials.
| Metric | Type | Labels |
|---|---|---|
compass_http_requests_total |
counter | route, method, status |
compass_http_request_duration_seconds |
histogram | route |
compass_source_refresh_total |
counter | source, outcome (success|error) |
compass_source_refresh_duration_seconds |
histogram | source |
compass_source_services |
gauge | source |
compass_source_last_success_timestamp_seconds |
gauge | source |
The source label uses Compass's canonical <type>/<name> source identity,
for example kubernetes/cluster.
last_success_timestamp_seconds is the Unix time of the most recent
successful refresh. Pair with time() for stale-source alerting:
A ServiceMonitor for prometheus-operator ships with the Helm chart;
enable it with serviceMonitor.enabled: true.
Logs
Every HTTP request emits one structured log line: method, path, status,
byte count, duration, and remote address. Source refresh outcomes log
here too. /health, /static/*, and /metrics log at debug to keep
probe and scrape traffic quiet; everything else logs at info. 5xx
responses always log at error.
Configure the format and level in compass.yaml under
logging:.
Troubleshooting
Compass exposes three places to check when something looks wrong:
/debug: per-source status, service counts, last successful load time, raw source errors, and the discovered service table./metrics: scrapeable source refresh counters, refresh duration, service counts, and last-success timestamps.- Logs: startup validation errors, source refresh outcomes, HTTP requests, and 5xx responses.
Source identities use <type>/<name>, for example kubernetes/cluster. Use
that value to match a source across /debug, metrics labels, and logs.
Compass Will Not Start
Config errors are printed during startup and include the field that failed validation. For the full config reference, see Configuration.